Making sense of Linux memory usage, Part 1: how to read “top” in CentOS.
We get this question a lot, about “Why is my Linux server using so much ram?”. In many cases, it really isn’t using much ram at all, but just to be sure we always have to check. At least half the time, really very little is being used, but the way that Linux reports ram usage, this is not at all clear. This article is going to give you some tips on how to evaluate Linux ram usage in order to gauge whether or not your server is operating properly, and whether or not you might benefit from more ram.
The screenshot below is from CentOS, but should be nearly identical in most Linux OS’s.
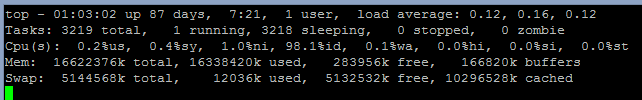
This is a pretty typical output for “top” for a server with 16gb ram. Looking down at the memory portion, you see 2 rows and 4 columns.
On the first row, you have the total installed memory in the system, followed by “used” memory, followed by “free” memory, and ending with “buffers” memory.
On the second row, you have total swap memory space available on the server, followed by the amount of swap memory used, the amount of swap memory free, and finally the amount of memory used by Linux disk caching.
Let’s explain some of the more confusing numbers first:
- The “buffers” memory is memory used by Linux to buffer network and disk connections. In our example, there is 166MB of buffer memory in use, which is a fairly reasonable amount. If this was 1gb or higher, I would suspect something crazy was going on in the OS. If you suspect you’re running out of memory, and you see a large amount of memory used for buffers, then you need to evaluate why. Possibly you have very aggressive TCP settings combined with a large number of simultaneous connections. If this is the case, the large buffer memory use is expected, but you may want to tune some of your TCP parameters down in order to save memory here. Often times however, this amount of buffer use is a bit of a mystery, and not intentional. You may try rebooting the server to see if it clears up, but if you can’t find the underlying cause of this, you may need to paper over the problem by adding more ram. Just keep in mind, that large buffer memory use is *not* normal.
- Cached memory is another misunderstood component of Linux memory usage. By default, CentOS (and most other Linux distributions), will use any available free ram to cache access to files on disk. This is normal, and helps speed up disk access. When the system runs low on free memory, Linux will automatically flush this data out of ram to make room for programs and other essential data. Therefore, when evaluating your free ram usage, and your used ram usage, you need to subtract the “cached” memory from those values to arrive at an accurate number.
So that explains buffers and cached memory. You can see that in order to arrive at a real amount of free memory, you need to add the amount “free” with the amount “cached” and you will then see how much ram is actually available to programs. In our example above, only 283MB is shown as “free”, but 10.3GB of ram is used for caching, and can easily be freed up as needed. For this reason, the “true” free ram in our example is actually 10.6GB, a perfectly healthy amount for a 16gb ram server.
The other thing to look at is your swap memory, so let’s go over that a bit:
- Some articles still recommend swap space equal to twice the amount of ram that you have. In modern systems with 8gb, 16gb, or even 72gb ram, this level of swap file space is absurd. Instead, we generally recommend around 4gb of swap memory. This is sufficient that Linux can shuffle off a bit of unneeded memory to disk, but not so much as to use an enormous amount of disk space.
- More importantly than the disk space used, is the disk i/o that is used up when swapping things into and out of virtual memory. In “top” above, you can see the value “0.1%wa”. This is the amount of cpu being used for disk i/o wait. On an 8 thread system, a 12.5% value would mean that a single core is always waiting for the disks, and this is essentially the same as waiting for the disks 100% of the time. On a 4 thread system, 25% would indicate waiting 100% of the time, on a 2 core system 50%, and so on. As you can see from the value 0.1%, there is very little waiting on disk i/o, and so most likely we also do not have a lot of memory swapping into and out of virtual memory. This is good news.
- Although the “real free ram” can be calculated by adding free ram to cached memory, it is also worthwhile to look at the amount of virtual memory in use. If you have a large amount of “swap” used, or not much “swap” free, then something may be leaking memory or otherwise using too much, even if the total of “free + cached” looks good. The first step here would be to reboot the server if it has been running for a long time. If it has not been running for several days or weeks, then you either have a program that is leaking memory, or you simply need more ram for the kind of load and configuration you’ve put on your server.
If, like our example, used swap is very low, disk i/o is very low, free swap is large, and the total of disk cache + free ram is large, you don’t have any problem with memory. Congratulations!
So how do you measure and monitor free ram if the Linux value “free ram” is so misleading? With graphs!
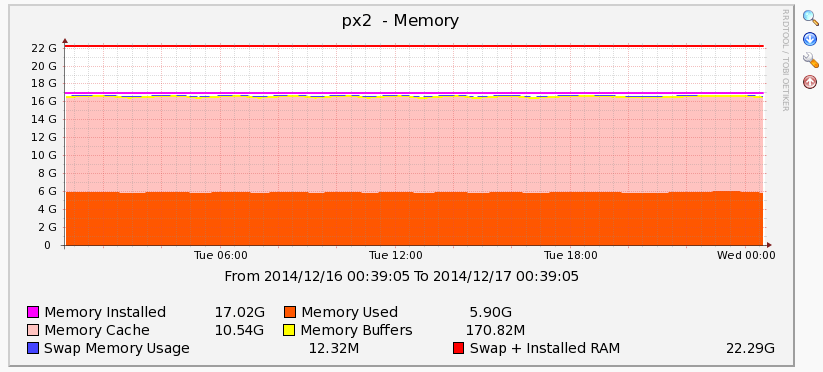
In order to create this graph, we created a custom Cacti RRD template. This template takes all the bits and pieces of memory use, and creates one summated stacked graph. Instead of just showing “free” or “used” ram, we calculate used ram as the total amount used minus the buffers and minus the cache. We then graph that in orange. Stacking on top of that, we graph the memory cache. Above that, we show buffers, and swap memory in use (yellow and blue). There is a line for total physical ram, and another line for total physical + virtual ram.
This particular server above is behaving normally and so some of these are hard to see. This is an example of a “good” graph, with very little swap used, “real used memory” well below available memory, and the remaining amount of memory as linux disk cache in pink. A healthy server should look like this.
A more interesting example is below:
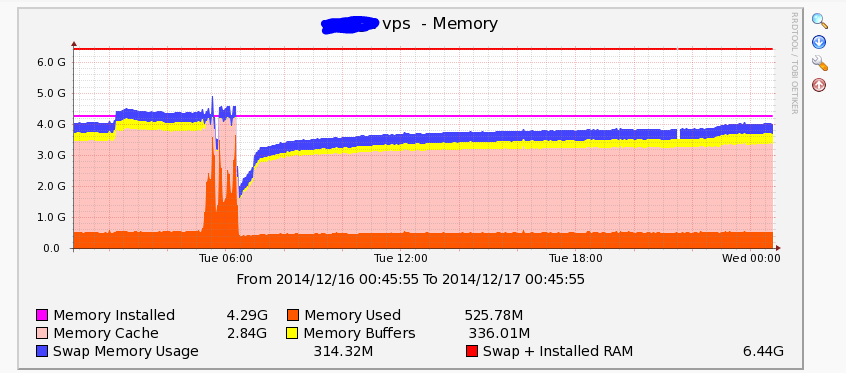
As you can see above, there are a few interesting things going on. First off, due to the lower amount of total ram, the buffers (yellow) are more visible, although they still don’t take up an unreasonable amount of ram. Secondly, there is some swap file usage (blue) throughout the entire graph, although this is not high enough to be of serious concern. More interestingly, you can see that around Tuesday at 6am, the “real ram use” spiked quite a lot, and cache memory use plummeted. After the event finished, cached memory use gradually built back up as files were read from disk.
The above graph tells an interesting story. First of all, had the server crashed, a graph like this would help you find the cause, as you would know it was from an unusual out of memory situation. I say unusual because you can see that typical “real” ram use is below 1gb, with most of the ram typically being used by disk caching. During the “event” you can see that “real” ram use spiked to nearly all the available memory in the system. You can see however that we did not exhaust the physical memory and use lots of virtual memory, as the total height of the graph does not extend upwards beyond the physical line. So in this case, everything worked perfectly. Linux used spare memory for disk cache when it was available, and when real memory needed to be used by programs, it cleared the disk cache to make ram available.
If you had simply looked at “used memory” in top, without an understanding of cache memory, you would have missed this story completely!
I hope that the above article helps you evaluate memory usage in Linux and CentOS. In the future, if you are unsure about ram usage, you can make an educated evaluation of the available ram, disk cache, swap memory, buffer memory, and disk i/o wait to see if you truly are running out of ram or not. Further, although this article doesn’t go into how to set up cacti graphs, I hope you can see the value in graphing the critical metrics on your server, and the essential information that can provide you.
If you have any questions about this information, or want to learn about IOFlood.com Dedicated Servers, email us at sales [at] ioflood.com
About Author
Gabriel Ramuglia
Gabriel is the owner and founder of IOFLOOD.com, an unmanaged dedicated server hosting company operating since 2010.Gabriel loves all things servers, bandwidth, and computer programming and enjoys sharing his experience on these topics with readers of the IOFLOOD blog.